
Seeing Beyond the Door: How Footfall Analytics Give APAC Retail Leaders Real-Time Store Intelligence
Footfall analytics is becoming a practical store operations capability for retailers in Singapore and APAC because it answers a question POS data cannot: what happened before the transaction?
Sales reports show what was bought. They do not show how many shoppers entered the store, which areas attracted attention, how long people stayed, whether traffic converted into purchases, or when congestion started affecting customer flow. For retail leaders managing multiple stores, that missing layer matters. Without real-time footfall data, teams can be busy every day and still miss the operational signals that explain performance.
xTrack
Aggregated people counting, footfall analytics, dwell time, conversion, zone analysis, occupancy, and shopper journey signals
Learn More →The pressure is visible across the region. Singapore's refreshed Retail Industry Digital Plan, launched by EnterpriseSG and IMDA on 26 May 2026, identifies rising operating costs, manpower constraints, and stronger global e-commerce competition as core challenges for the sector. The same initiative is designed to guide more than 2,000 SME retailers on technology adoption, with its factsheet noting that 88 percent of eligible retail enterprises are keen to adopt at least one sector-specific solution in 2026.
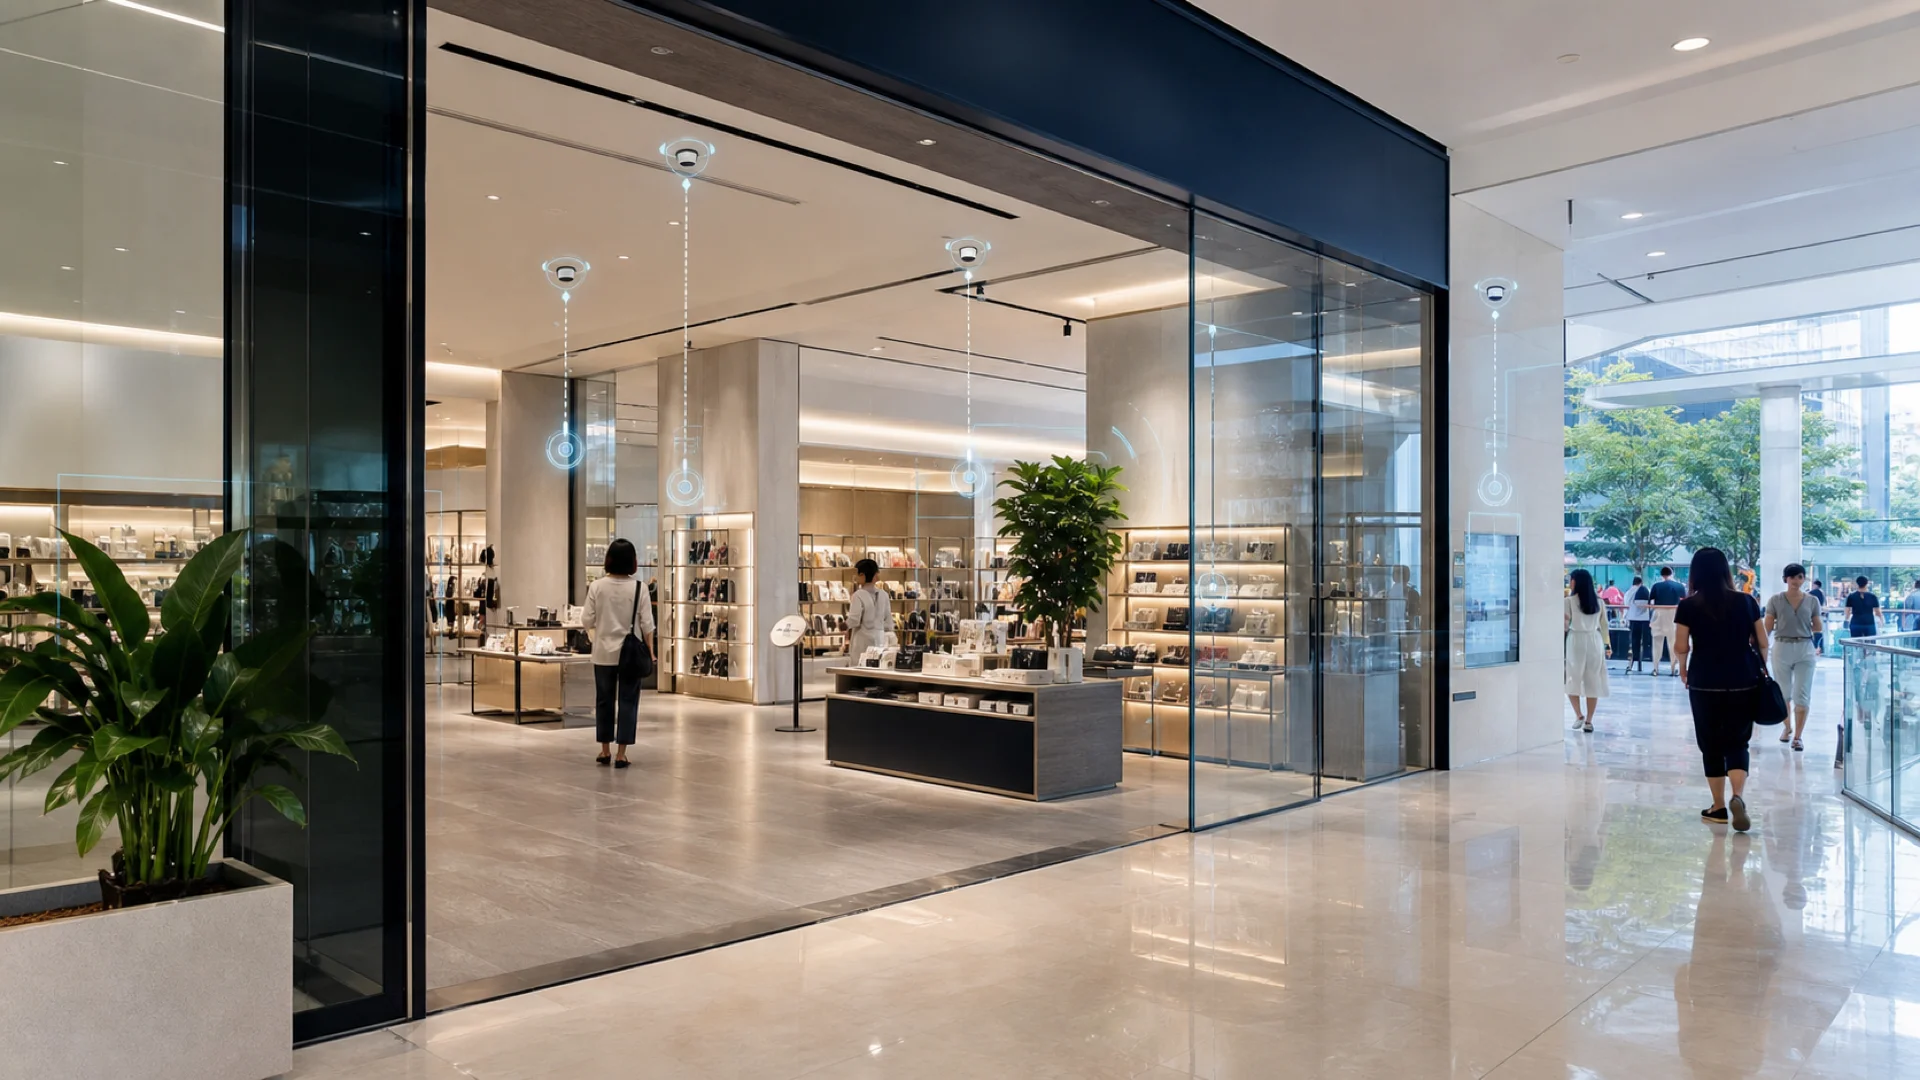
That context matters because the next phase of retail digitalisation is not just about installing more systems. It is about connecting the right signals to daily decisions. Store leaders need to know where traffic is coming from, how shoppers move, which zones underperform, and where staff attention is needed. This is where xTrack, Vortex Cloud, and xPilot 3 Pro form a system-level approach: xTrack captures in-store movement signals, Vortex Cloud unifies them into a real-time operations view, and xPilot 3 Pro helps protect the network connection that keeps store intelligence flowing.
POS shows what sold. Footfall analytics shows what was missed
Retail reporting often starts with sales. That is understandable. Sales are measurable, familiar, and directly tied to revenue. But sales alone can hide two very different problems.
A store with weak sales may have low traffic, which points to location, campaign, window display, or mall traffic issues. Another store may have healthy traffic but low conversion, which points to merchandising, product availability, service coverage, pricing, or customer experience issues. Without footfall counting and retail traffic analytics, both stores can look similar in a sales report even though the operational response should be different.
Footfall analytics adds the missing denominator. When operations teams compare visitor traffic with transactions, they can start reading store conversion rate as a daily operating signal rather than a retrospective finance metric. A flagship store, suburban mall outlet, airport store, and shop-in-shop location may all have different traffic patterns. The right question is not simply which store sold more. It is which store converted available demand most effectively.
For APAC retail leaders, this is especially important across mixed-format networks. Singapore retailers may operate in malls, transit hubs, high street locations, and compact neighbourhood formats. Regional teams may need to compare stores across Singapore, Malaysia, Indonesia, Thailand, Vietnam, and the Philippines, where mall behaviour, staffing models, promotion calendars, and store formats vary. Real-time footfall data gives leadership a common operating language across those differences.
What real-time store intelligence should show
The value of store analytics APAC teams need is not a dashboard full of disconnected charts. It is a practical view of customer flow and store performance that helps teams decide what to do next.
At minimum, real-time store intelligence should answer seven operational questions: how many people entered each store, when shoppers arrive, where shoppers spend time, which zones are underused, whether traffic converts into transactions, where congestion builds up, and how stores compare across the network.
Footfall counting gives teams a baseline for demand. If sales are down but traffic is stable, the issue may sit inside the store experience. If both traffic and sales are down, the focus may shift to marketing, location, trading hours, or external foot traffic.
Dwell time analytics can reveal which departments, displays, shelves, or experience zones attract attention. High dwell time may indicate strong interest, but it may also signal friction if shoppers spend time without converting.
Zone-level movement data can show dead zones, layout problems, weak product placement, or areas shoppers pass without engagement. Occupancy and customer flow signals can also help teams spot pressure in service areas, entrances, promotional zones, fitting areas, and counters. The goal is not to track individuals. It is to understand aggregated movement patterns so teams can reduce bottlenecks and protect the store experience.
From store signal to operations system: xTrack, Vortex Cloud, and xPilot 3 Pro
Footfall analytics becomes more valuable when it is treated as part of the store operating system, not a standalone report.
xTrack is the in-store intelligence layer. It supports aggregated people counting, footfall analytics, dwell time analytics, conversion analysis, zone analysis, occupancy monitoring, and shopper journey signals. For the article implementation team, avoid adding claims about accuracy, latency, camera coverage, identity recognition, demographic analytics, or processing architecture unless verified from approved xRetail materials.
Vortex Cloud is the unified dashboard layer. For regional operations teams, a single-store report is useful, but a multi-store analytics dashboard is where the management value increases. Vortex Cloud should be positioned as the layer that brings real-time footfall data and store operations visibility together, helping leaders compare locations and monitor store-level signals without stitching together disconnected reports.
xPilot 3 Pro is the resilience layer. Store intelligence depends on reliable connectivity. If a store network drops during trading hours, reporting, monitoring, POS connectivity, payment reliability, and IoT device visibility can all be affected. xPilot 3 Pro should be positioned as a 5G failover retail and multi-WAN failover gateway that supports retail network resilience. Do not include specific failover timing, WAN counts, uptime promises, supported bands, or remote management details unless verified from product documentation.
Together, the system story is straightforward. xTrack captures what happens in the store. Vortex Cloud helps operations teams see it across locations. xPilot 3 Pro helps keep the network layer resilient so data, devices, and store operations stay connected during disruption.
Why this matters in Singapore and APAC
Singapore's retail sector remains large, competitive, and cost-sensitive. The Retail IDP factsheet cited by EnterpriseSG and IMDA notes more than 27,500 retail enterprises as of 2023 and sector output of S$42.2 billion. At the same time, the industry is navigating manpower shortages, rental and operating cost pressure, e-commerce competition, and shoppers who expect more digital and experiential store journeys.
Sales trends alone do not explain store traffic quality, conversion, dwell time, or operational causes. SingStat reported that Singapore retail trade sales rose 4.0 percent year on year in June 2026, while food and beverage services sales decreased 2.3 percent year on year. Those indicators help leaders understand the market, but they do not tell a store operations team why one location outperformed another.
This is why retail leaders need store-level intelligence. NRF Retail's Big Show APAC 2026 in Singapore highlighted themes including AI-driven customer experiences, intelligent supply chains, data analytics, and connected retail. Deloitte has also reported that only around 30 percent of Asia Pacific consumer businesses say at least 40 percent of their AI initiatives reach production. The lesson is practical: AI projects need to be tied to real operating decisions, not vague experimentation.
For footfall analytics, that means focusing on decisions store teams already make: how to staff peak periods, which layouts deserve testing, which promotions attract attention, where customer flow slows down, and which stores need support.
Practical implementation guidance for APAC retailers
Retailers should start with the store decisions they want to improve, then map the analytics signals to those decisions.
A practical first phase is traffic visibility. Track people counting, hourly traffic, daily patterns, and store-level trends. This answers the basic but critical question: how much demand is the store receiving?
The second phase is traffic-to-sales conversion. Add store conversion rate by daypart, campaign period, and store format. This helps teams identify whether sales changes are driven by traffic volume or in-store execution.
The third phase is customer flow. Use zone analysis, dwell time analytics, occupancy monitoring, and shopper journey signals to understand how visitors move through the store. This can support merchandising, layout, service-area planning, and congestion reduction.
The fourth phase is multi-store visibility. Bring store-level signals into Vortex Cloud so leadership can compare stores, spot outliers, and monitor operations in one place. If each store runs its own local view, regional leaders still lack a consistent operating picture.
The fifth phase is continuity planning. Review retail network resilience with xPilot 3 Pro so store intelligence remains dependable even when connectivity conditions vary. For retailers with distributed stores, pop-up locations, mall environments, or lean IT coverage, resilience is part of the analytics plan.
Finally, set governance boundaries. Shopper intelligence should be presented as aggregated operational insight, not personal identity tracking. Teams should define what is measured, why it is measured, who can access the dashboard, and how data supports store decisions. This is especially important in Singapore and APAC markets where privacy expectations, brand trust, and operational compliance matter.
What to measure first
A phased measurement plan keeps deployment practical.
Phase one should focus on traffic visibility: people counting, hourly traffic, daily patterns, and store-level trends.
Phase two should connect traffic to sales through store conversion rate by daypart, campaign period, and store format.
Phase three should improve customer flow through zone analysis, dwell time analytics, occupancy monitoring, and shopper journey signals.
Phase four should scale visibility by bringing store-level signals into Vortex Cloud so leadership can compare stores, spot outliers, and monitor operations in one place.
Phase five should strengthen continuity by reviewing retail network resilience with xPilot 3 Pro so store intelligence remains dependable even when connectivity conditions vary.
This staged approach mirrors where many retailers are today. Singapore's Retail IDP context shows strong adoption of entry-level and intermediate solutions among SMEs, while advanced adoption remains more limited. The next step is not technology for its own sake. It is moving from basic digitalisation to operational intelligence that store teams can use.
Avoiding the AI pilot trap
APAC retail leaders are right to be selective about AI projects. A pilot that produces dashboards but does not change store decisions is unlikely to survive.
Footfall analytics avoids that trap when it is tied to clear operating routines. Store teams should know which metric they review, what action follows, and how results are compared. A high-traffic, low-conversion store may need a different response from a low-traffic store. A zone with high dwell time but weak sales may need merchandising review. A store with recurring congestion may need staff redeployment or layout changes. A location with missing data may need device health or connectivity review.
The strongest retail AI deployments are not the ones with the most impressive terminology. They are the ones that help leaders make better decisions faster.
For xRetail, the opportunity is to help APAC retailers see beyond the door. Footfall analytics gives stores the signal. Vortex Cloud gives leaders the operating view. xPilot 3 Pro helps protect the connectivity foundation. Together, they turn in-store movement into real-time store intelligence.
See how xTrack, Vortex Cloud, and xPilot 3 Pro can turn in-store movement into real-time operational visibility. Talk to xRetail about connecting footfall analytics, multi-store dashboards, and resilient retail networking across your APAC stores.
Frequently Asked Questions
What is footfall analytics in retail?
Footfall analytics uses aggregated people counting and movement signals to help retailers understand how many shoppers enter a store, when they arrive, where they spend time, and whether traffic converts into transactions.
How is footfall analytics different from POS reporting?
POS reporting shows completed transactions. Footfall analytics shows the demand and movement patterns behind those transactions, helping teams understand whether performance issues are caused by low traffic, low conversion, weak zone engagement, congestion, or store execution gaps.
Why does real-time footfall data matter for APAC retailers?
APAC retailers often manage diverse store formats, high operating costs, manpower constraints, and changing shopper expectations. Real-time footfall data helps teams respond faster to traffic patterns, staffing needs, layout issues, campaign performance, and multi-store performance differences.
How does Vortex Cloud support store analytics?
Vortex Cloud is xRetail's unified real-time dashboard for store operations. It helps bring store-level signals into one management view so leaders can compare performance across locations and reduce fragmented reporting.
Why does connectivity matter for footfall analytics?
Store intelligence depends on connected devices, cloud reporting, and reliable data flow. xPilot 3 Pro supports retail network resilience by providing a failover gateway layer for stores where connectivity continuity matters.
Sources
- EnterpriseSG and IMDA: Refreshed Industry Digital Plan to Support Retailers
- Singapore Department of Statistics: Monthly Retail Sales Index and Food & Beverage Services Index, June 2026
- Singapore Retailers Association: Budget Recommendations 2026
- NRF Retail's Big Show APAC 2026
- Deloitte Southeast Asia: Asia Pacific set to lead the agentic future of commerce
- Research and Markets: Computer Vision for Retail Market Report 2026
Related Articles
Continue exploring insights from xRetail Solutions
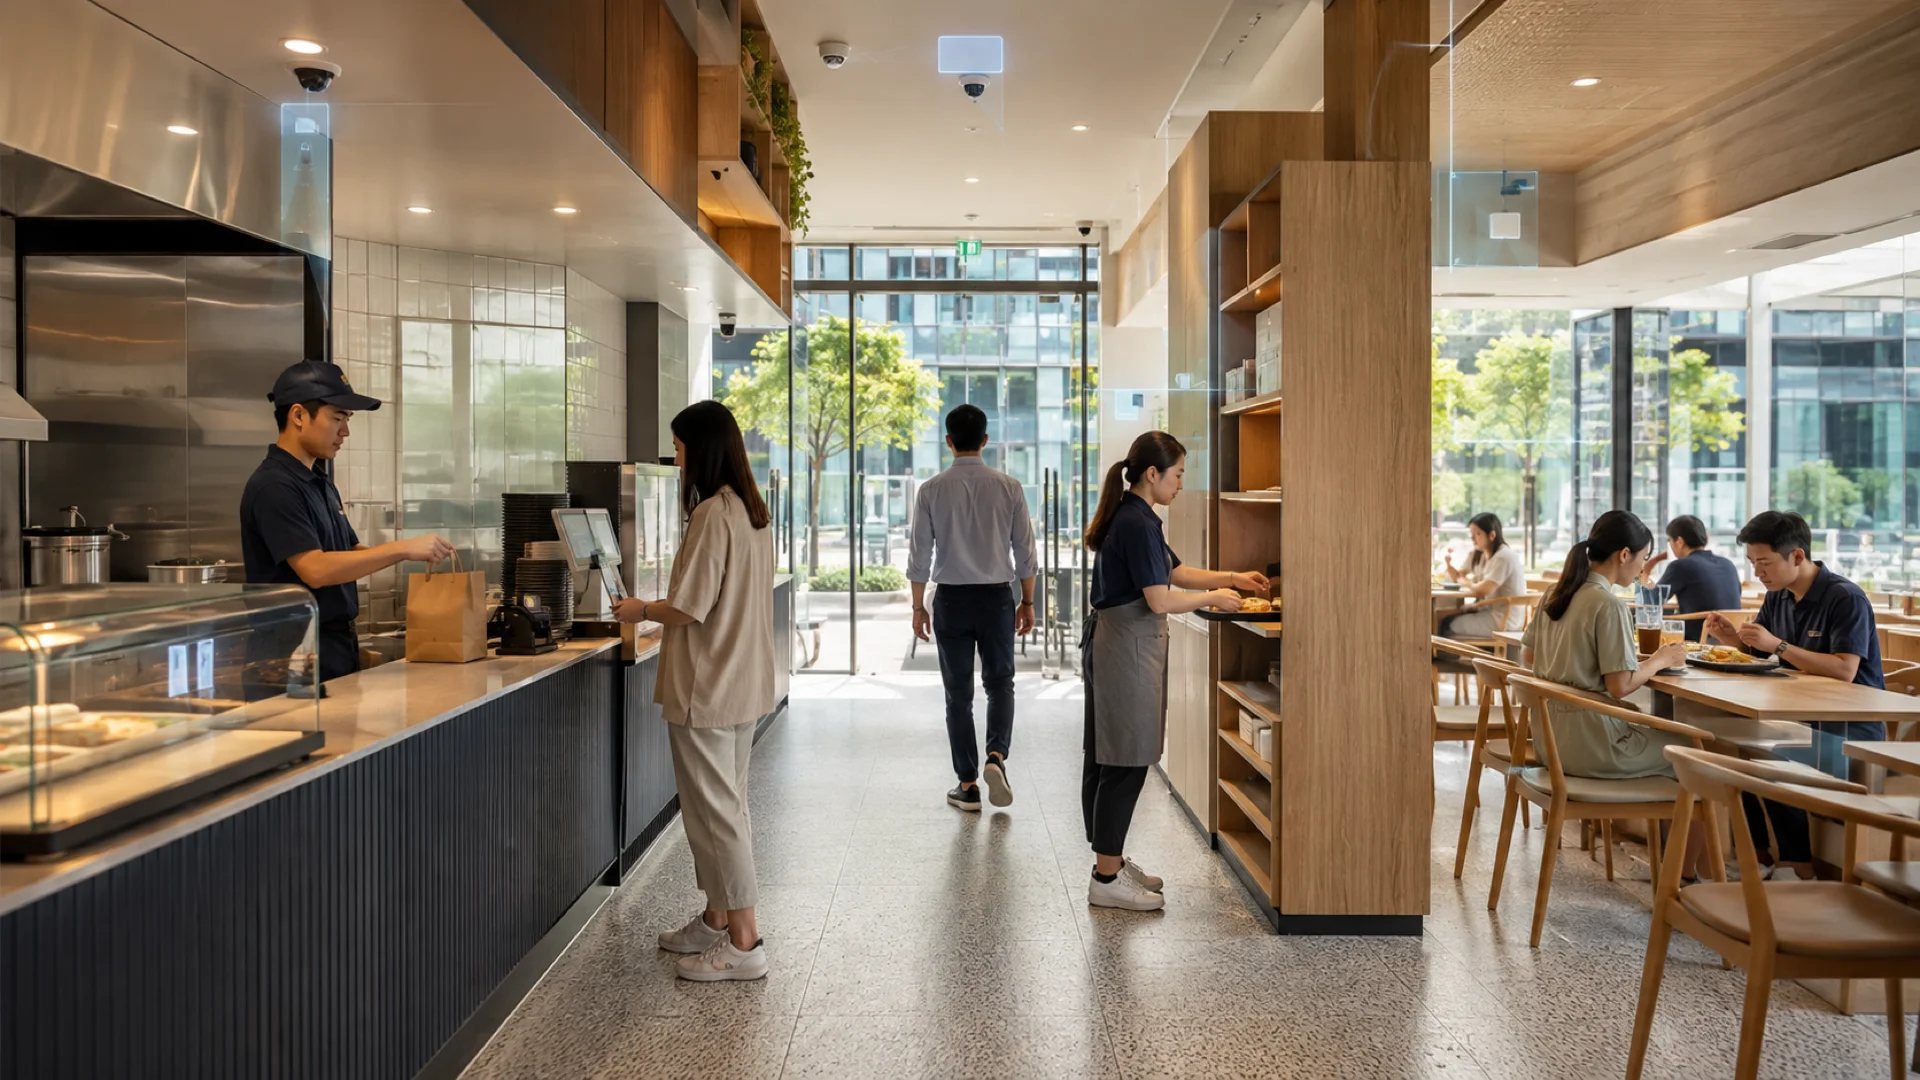
Counting Every Guest: How QSR and Restaurant Chains in Singapore/APAC Turn Footfall Data into Faster, Better Service
September 3, 2026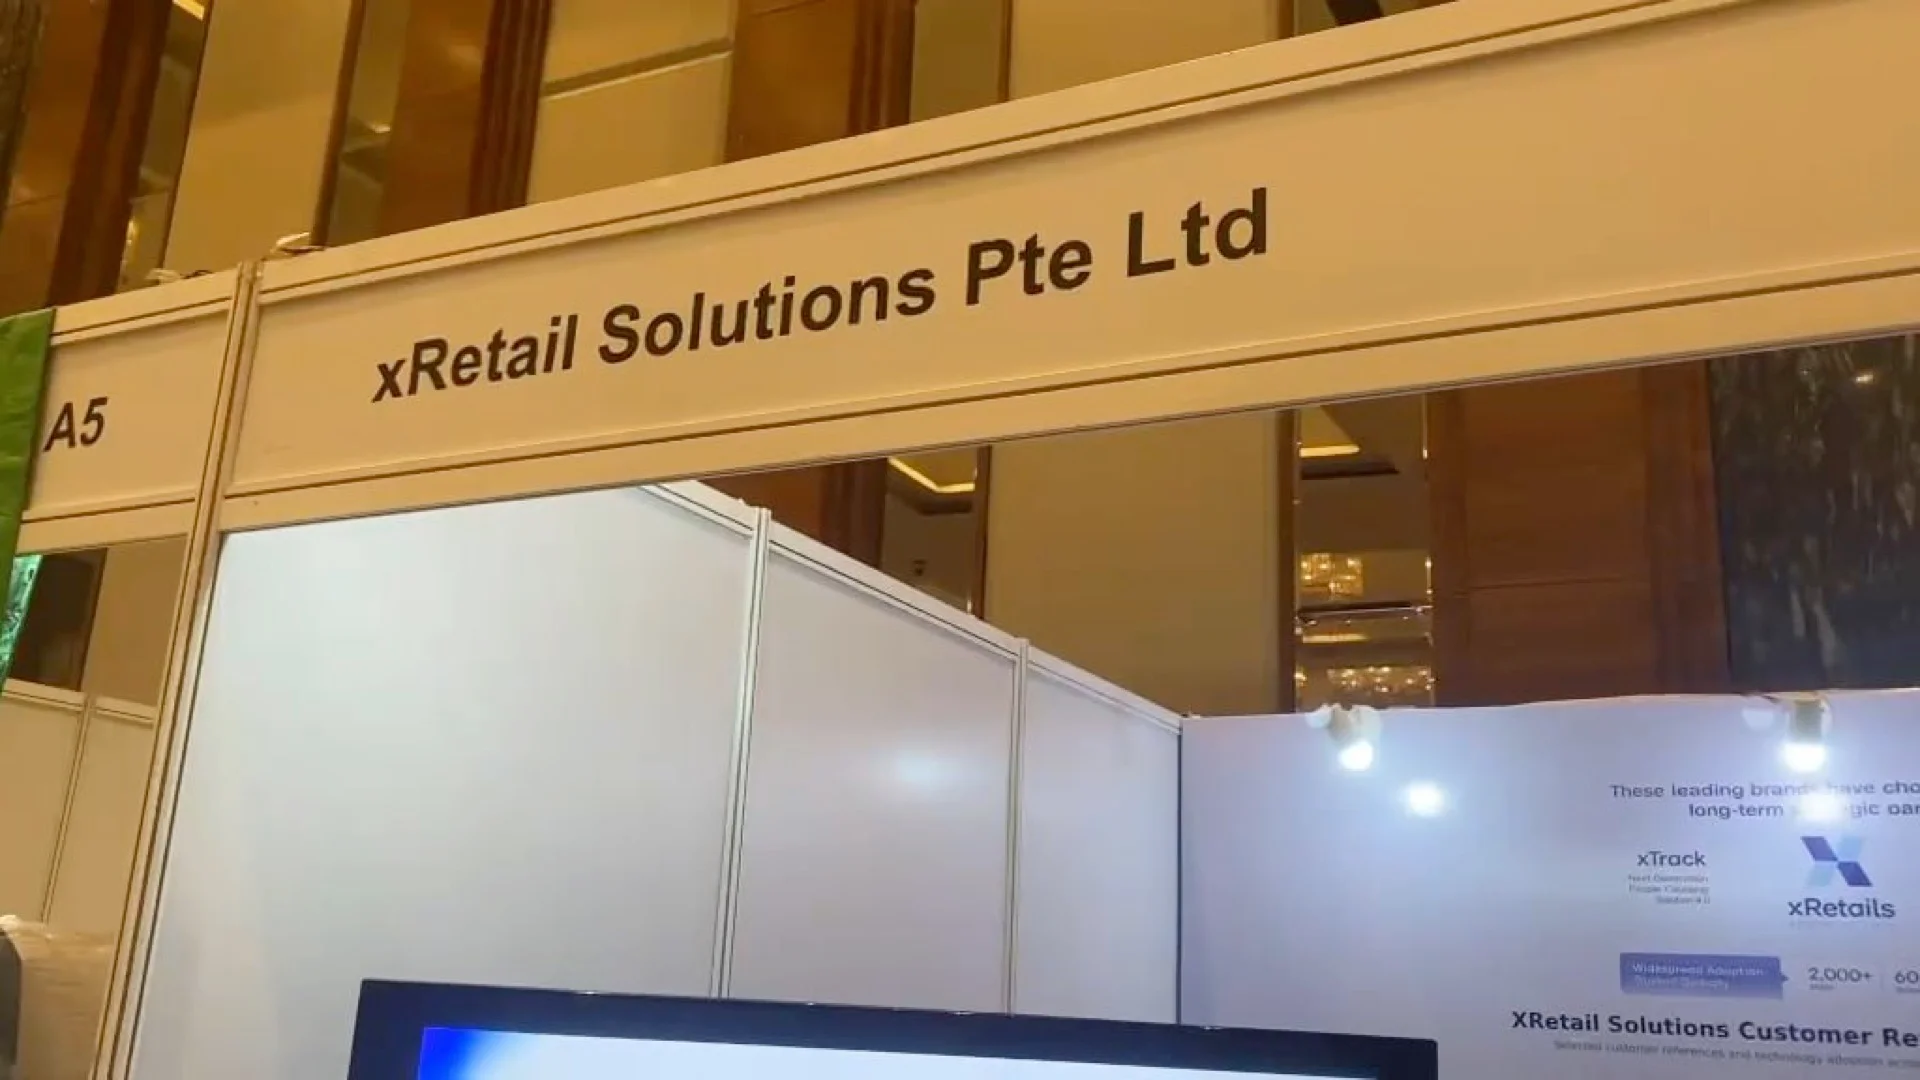
xRetail at IRSE 2026: Rethinking Retail with Indonesia’s Retail Leaders
August 27, 2026
One View of Every Store: How Unified Operations Dashboards Give APAC Retail Leaders Real-Time Control
August 27, 2026Ready to Transform Your Retail Operations?
Explore how xRetail Solutions connects shopper intelligence, resilient store networks, and unified operations visibility for modern retail teams.
Contact Our Team