
Counting Every Guest: How QSR and Restaurant Chains in Singapore/APAC Turn Footfall Data into Faster, Better Service
Footfall analytics gives QSR and restaurant operators a clearer view of what happens before a transaction appears in the POS. Sales data can show what was purchased, when revenue peaked, and which items moved. It does not show how many guests entered, which service areas they used, how long they stayed, whether traffic translated into transactions, or whether a promotion created visits without enough commercial impact.
For Singapore and APAC restaurant groups, that missing layer matters. SingStat reported that Singapore Food and Beverage services sales decreased 2.3 percent year-on-year in June 2026, while retail trade rose 4.0 percent in the same period. Earlier in February 2026, Food and Beverage services sales rose 5.5 percent year-on-year. These month-to-month shifts underline a practical reality for operators: demand is not static, and outlet decisions cannot rely on sales totals alone.

xTrack
Footfall counting, people counting, dwell time analytics, conversion rates, zone analysis, occupancy monitoring, and shopper journey visibility
Learn More →This is where xTrack supports restaurant operations teams. By measuring footfall counting, people counting, dwell time, conversion rates, zone analysis, occupancy monitoring, and shopper journey patterns, xTrack helps operators connect guest traffic with outlet performance. Vortex Cloud then gives leadership a unified view across multiple locations, while xPilot 3 Pro supports the retail network resilience needed to keep outlet data moving reliably.
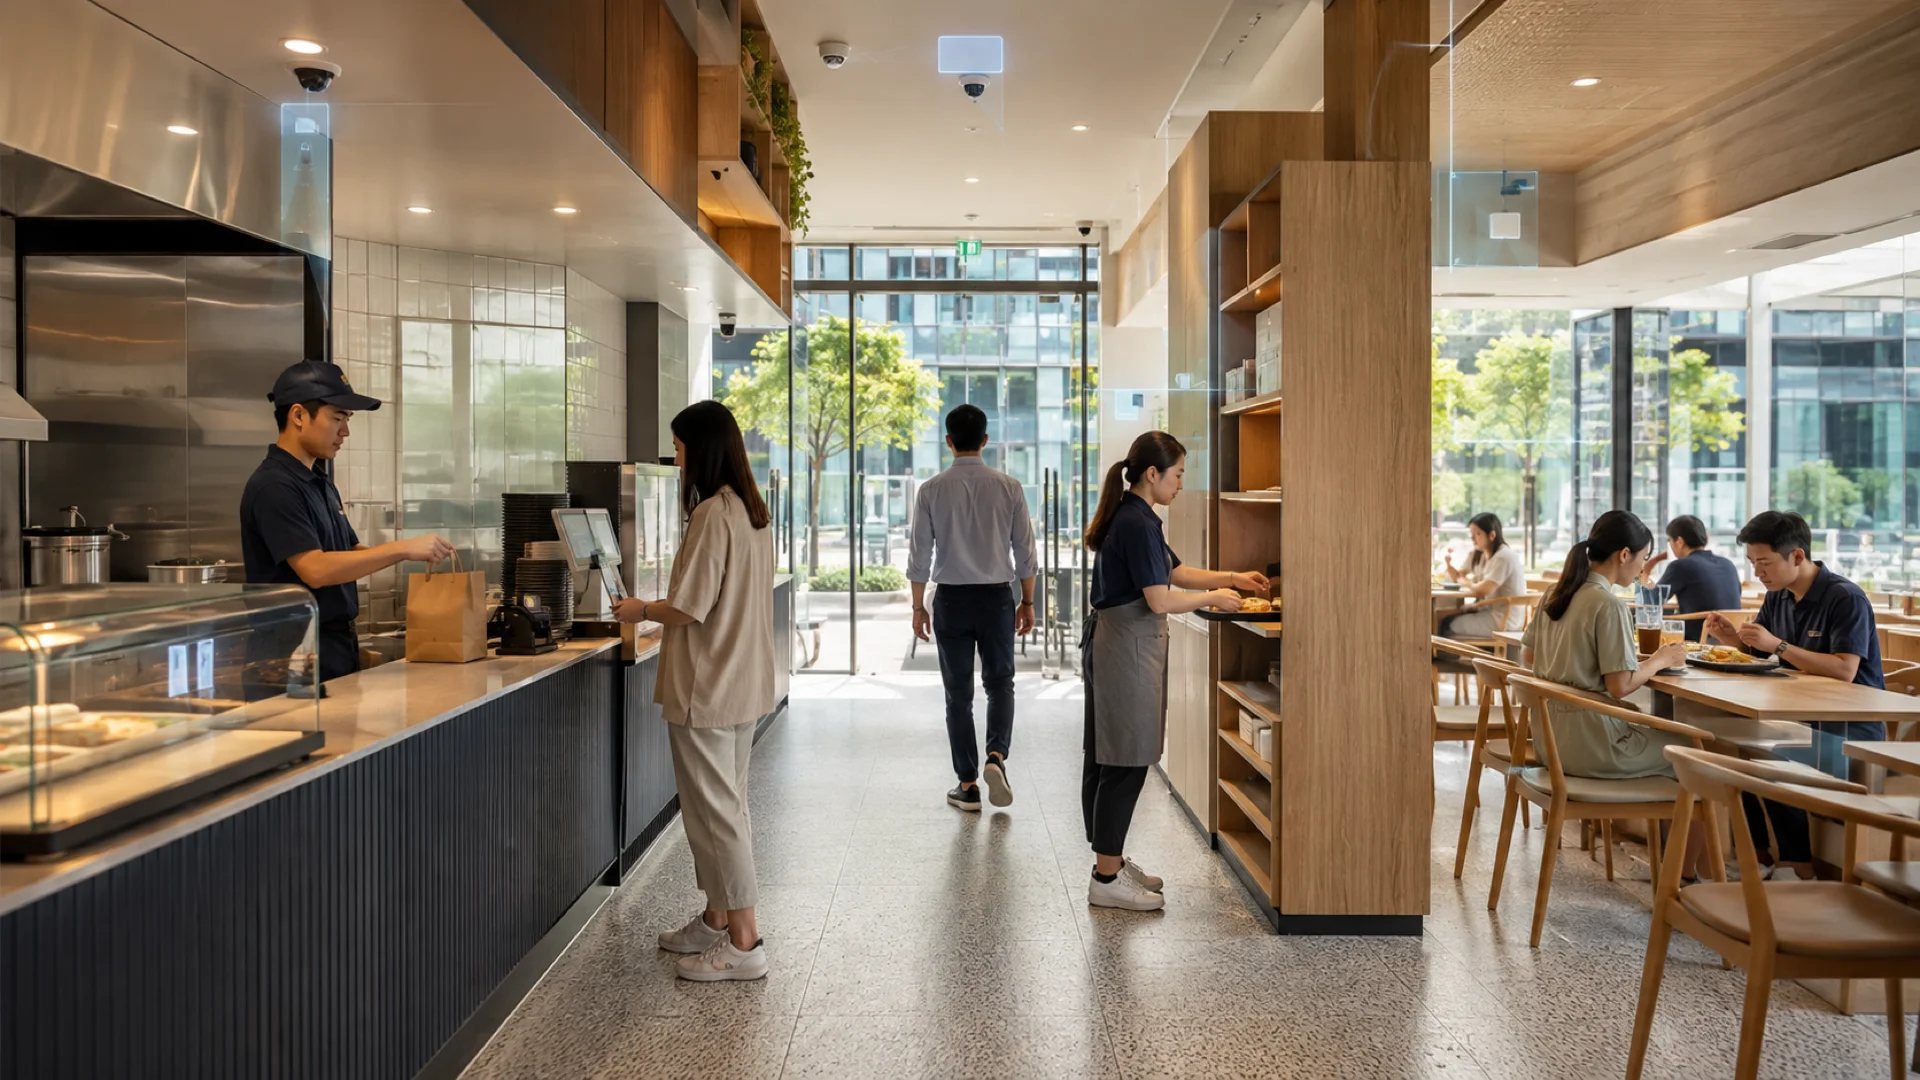
The goal is not to replace POS, labour planning, or operational judgement. It is to add the missing operational context between guest movement and business results.
Footfall Analytics for QSR and Restaurant Operations
In a restaurant setting, footfall analytics is the measurement of guest movement through physical spaces. For QSR, fast casual, cafe, and casual-dining formats, the most useful measurements are often simple but powerful.
Footfall counting shows how many guests enter an outlet over a given period. People counting shows how guest volume changes by hour, daypart, weekday, weekend, outlet, or campaign period. Occupancy monitoring shows how many people are present in defined areas at a point in time. Dwell time analytics shows how long guests spend inside the outlet or within selected zones.
Zone analysis helps teams understand which service areas, ordering points, pickup counters, seating sections, product displays, or promotional areas attract attention. Conversion rates compare traffic with completed transactions, giving teams a clearer view of traffic to sales conversion. Shopper journey analysis shows how guests move from entrance to ordering, pickup, seating, promotional displays, or exit.
These measurements should not be treated as one generic traffic number. Entries, live occupancy, dwell time, and zone-level movement each answer different operational questions. A day with high entries but modest sales requires a different response from a day with low entries but strong conversion. A busy lunch period with short dwell time may indicate fast throughput, while high occupancy and long dwell time in a constrained service area may point to a layout or staffing bottleneck.
For multi-outlet brands, the value increases when these signals are compared across locations. A single outlet manager may know what happened yesterday. A regional operations leader needs to know whether that pattern is local, format-specific, mall-driven, weather-related, or visible across the estate.
The Cost of Operating Without Guest-Flow Data
Many restaurant teams already have rich transactional data. The problem is that POS data starts too late in the journey. It records the purchase, not the full operating conditions that shaped the purchase.
Without guest-flow data, an outlet team may see weaker sales and assume demand was soft. In reality, the outlet may have had healthy guest traffic but lower conversion. Another outlet may post similar sales with fewer visitors, suggesting stronger conversion or higher average spend. Without footfall counting and conversion context, both outlets can look similar on a revenue report while performing very differently on the ground.
Teams may misread low sales. Low revenue can come from low traffic, weak conversion, limited service-area use, poor menu visibility, or mismatched staffing across dayparts. Each cause needs a different operational response.
Staffing decisions can also lag real demand. Restaurant demand varies by hour, day, mall traffic, weather, local events, and campaign activity. Guest traffic data helps operators compare planned labour against actual outlet patterns, especially in markets such as Singapore where manpower planning is a constant operating pressure.
Layout decisions become subjective without consistent data. Operators may know that one area feels crowded or that another section seems underused, but they may lack consistent data across opening hours and locations. Zone analysis can show which areas attract attention and which areas do not support the intended customer flow.
Promotion measurement also stays incomplete. A campaign can lift visits without lifting transactions proportionally. Another can improve conversion without dramatically increasing total visits. Footfall analytics helps separate traffic impact from sales impact.
Finally, leadership can struggle to compare outlets fairly. In a multi-outlet restaurant estate, one outlet may sit in a transport hub, another in a suburban mall, another near offices, and another in a mixed-use precinct. A unified retail operations dashboard gives teams a common operating language across formats.
What Singapore and APAC Restaurant Teams Should Measure
The right measurement framework should reflect how restaurant work actually happens. For QSR and casual dining, a practical model starts with five questions.
1. How many guests entered by hour and daypart?
Hourly footfall counting helps operators identify the real rhythm of each outlet. Breakfast, lunch, afternoon, dinner, and late evening patterns can vary widely by location type. An office-area restaurant may peak sharply around lunch. A mall outlet may see broader weekend demand. A transport-location outlet may see shorter bursts around commuter movement.
By comparing guest traffic with sales, operators can separate demand creation from demand capture. If footfall is high but conversion is low, the issue may sit in offer relevance, service-area design, operational readiness, or transaction flow. If footfall is low but conversion is strong, marketing, location visibility, or mall-level traffic may deserve more attention.
2. Which service areas are used most?
Zone analysis helps restaurants understand how guests use the outlet. Operators can review guest movement around ordering points, pickup counters, beverage stations, seating sections, promotional displays, and self-service areas.
This is especially useful when testing format changes. A new menu board, product display, pickup shelf, or seating arrangement may look logical on paper but behave differently during real service. Zone-level data gives operators a way to compare intended use with actual behaviour.
3. How long do guests stay?
Dwell time analytics can reveal whether guests are using a space as expected. In some QSR formats, shorter dwell time may align with fast throughput and takeaway behaviour. In cafe and casual-dining formats, longer dwell time may be part of the customer experience.
The important point is context. Dwell time should be interpreted by format, daypart, and service model. A single dwell-time number is less useful than a pattern: how dwell changes during peak periods, how it differs across outlets, and whether it moves after layout, staffing, menu, or campaign changes.
4. How full are key areas across the day?
Occupancy monitoring helps operators understand live space utilisation. For restaurants with dine-in seating, this can support better awareness of dining-area use across the day. For takeaway-heavy outlets, occupancy patterns in service areas can help identify bottlenecks and areas where customer flow may need adjustment.
Occupancy is not the same as entries. An outlet can have moderate entries but high occupancy if guests stay longer. Another can have high entries but lower occupancy if turnover is fast. Treating these as separate metrics helps teams avoid shallow conclusions.
5. How does traffic convert into transactions?
Store conversion rate is one of the most important bridges between footfall analytics and commercial performance. For restaurants, traffic to sales conversion helps operators ask sharper questions: did increased visits translate into more orders, did a campaign attract attention without enough transactions, did a particular daypart bring traffic that did not convert as expected, and did one outlet convert similar traffic better than another?
The answer does not need to produce a sweeping conclusion. It should guide a practical review of offer, staffing, service-area setup, menu visibility, and local demand.
Connecting xTrack, Vortex Cloud, and xPilot 3 Pro Across the Estate
For restaurant groups, the operational value of footfall analytics depends on how clearly data moves from outlet to decision-maker.
xTrack is the measurement layer. It supports footfall counting, people counting, dwell time analytics, conversion rates, zone analysis, occupancy monitoring, and shopper journey visibility. For QSR and restaurant operators, this creates a more complete picture of guest traffic and outlet use.
Vortex Cloud is the visibility layer. A multi-store analytics dashboard helps teams compare outlet performance, review real-time footfall data, and bring store operations into a single view. Instead of relying on fragmented reports, operations teams can look across locations and ask where guest traffic is rising, where conversion needs review, and where service-area utilisation differs from expectation.
xPilot 3 Pro is the connectivity resilience layer. Outlet analytics depends on reliable connectivity, especially when teams are monitoring many locations. A 5G failover retail network approach helps reduce the risk that store network downtime interrupts the flow of operational data. During scoping, operators should confirm outlet connectivity requirements, carrier options, device management needs, and deployment architecture for each market and store format.
Together, the three layers support a practical operating model: measure what happens in the outlet, view it consistently across the estate, and keep the network foundation resilient enough for ongoing visibility.
Practical Use Cases for QSR and Restaurant Chains
Staffing by real guest traffic
Sales alone can hide the workload inside an outlet. Two outlets with similar revenue may have very different guest volumes, dwell patterns, and service-area use. Footfall analytics helps operations teams understand when guests arrive, how long they stay, and where activity concentrates.
This can support better labour planning conversations, especially when paired with sales per man-hour or similar productivity metrics. EnterpriseSG notes that productivity benchmarks for food services include measures such as sales per man-hour to help companies understand outlet performance. Guest traffic adds another layer, helping teams see whether staffing aligns with the actual rhythm of each location.
Comparing low traffic with low conversion
When sales underperform, the first question should be whether the outlet lacked visits or failed to convert visits into transactions. A low-traffic outlet may need local marketing, signage review, mall collaboration, or daypart-specific demand creation. A high-traffic, low-conversion outlet may need an operational review around service areas, product visibility, menu offer, or staff deployment.
This distinction is especially important across APAC markets where location formats differ significantly. A Singapore CBD outlet, suburban mall store, travel hub location, and regional franchise site should not be judged by one sales number alone.
Reviewing outlet layout and service-area use
Restaurant layout is often evaluated through manager observation and customer feedback. Those inputs remain useful, but they can be strengthened with zone analysis. If a promotional display receives little attention, it may be in the wrong place. If a pickup area becomes a bottleneck during peak service, the team can test a different arrangement. If a seating area is consistently underused, the format may need adjustment.
EnterpriseSG describes outlet operation optimisation as including layout reconfiguration, technology adoption, menu engineering, job redesign, and improvements to manpower utilisation, revenue generation, and customer satisfaction. Footfall analytics can support this type of review by showing how guests actually use the space.
Measuring campaign and menu-launch impact
Promotions and new menu launches can influence guest visits, conversion, dwell time, and zone engagement. A campaign that increases guest traffic but does not lift conversion enough may still be useful for awareness, but it should be understood clearly. A menu launch that changes guest movement around displays or ordering areas may reveal operational effects that POS data alone cannot show.
Footfall analytics helps operators evaluate whether campaigns changed visits, not just sales. That distinction can improve post-campaign reviews and future planning.
Managing multi-outlet visibility
As restaurant groups expand, reporting fragmentation becomes a bigger operational problem. Each outlet may have its own manager notes, POS exports, network conditions, and local explanations. A unified retail operations dashboard gives leadership a cleaner way to compare patterns.
With Vortex Cloud, the operating question becomes more practical: which outlets need attention today, which patterns repeat across the estate, and which differences are expected because of format or location?
Implementation Checklist for Singapore and APAC Operators
Define the operating questions first
Do not start with every possible metric. Start with the decisions the team needs to improve. Examples include staffing by daypart, conversion review, outlet layout, campaign measurement, occupancy awareness, or regional performance comparison.
Clear questions make analytics easier to implement and easier for outlet teams to trust.
Separate entries, occupancy, dwell, zones, and conversion
Footfall analytics works best when each metric has a defined purpose. Entries show guest volume. Occupancy shows how many people are present in an area. Dwell time shows how long people stay. Zone analysis shows how space is used. Conversion connects visits to transactions.
Blending these together can create misleading conclusions. Keep definitions consistent across outlets.
Validate measurement quality during difficult periods
Computer-vision and people-counting accuracy depends on the real environment. Camera angle, lighting, occlusion, overlapping camera zones, entrance design, and visitor definitions all affect results.
Operators should validate results against manual observation during peak periods, quieter periods, and difficult lighting conditions. This is especially important before using the data for staffing, format changes, or management reporting.
Align privacy, cybersecurity, and data governance
Restaurant operators should confirm how any analytics system handles privacy, access control, retention, cybersecurity, and data protection. EnterpriseSG and IMDA announced a refreshed Food Services Industry Digital Plan in July 2025 that includes guidance areas such as digital solutions, AI use cases, cybersecurity, and data protection for F and B businesses.
During scoping, operators should align internal privacy requirements, data retention policies, access controls, cybersecurity responsibilities, and any market-specific governance needs before rollout.
Build outlet adoption into the rollout
Footfall analytics should not become another dashboard that only headquarters reads. Store managers and regional teams need clear definitions, simple routines, and decision rights.
For example, a weekly review might compare guest traffic, conversion, dwell time, and service-area use by outlet. A campaign review might compare traffic uplift with transactions across the same period. A layout review might compare zone use before and after the change.
Keep connectivity part of the architecture
Analytics visibility depends on outlet connectivity. If store systems lose network access, operations teams can lose timely visibility into outlet conditions. For multi-outlet restaurant groups, retail network resilience should be part of the analytics architecture from the beginning.
xPilot 3 Pro can be positioned as the connectivity resilience layer for outlet environments, helping operators design a more dependable foundation for multi-outlet visibility.
How to Turn Footfall Data Into Operating Rhythm
The strongest restaurant analytics programmes are not built around dashboards alone. They turn measurement into a regular operating rhythm.
Daily outlet review: Check traffic by hour, occupancy patterns, and any unusual service-area activity.
Weekly operations review: Compare traffic, conversion, and dwell time across outlets and dayparts.
Campaign review: Compare visits and transactions before, during, and after promotions or menu launches.
Layout review: Use zone analysis before changing service areas, seating, displays, or pickup points.
Regional review: Compare outlets by format, location type, and market rather than treating all sites as identical.
This keeps footfall analytics grounded in practical decisions. The purpose is not to create more reports. It is to make outlet conversations more specific, faster, and easier to act on.
Conclusion: Count Every Guest, Then Understand the Journey
Restaurant chains in Singapore and APAC operate in a market where demand can shift materially by month, outlet type, and daypart. POS data remains essential, but it cannot explain the full guest journey before the sale.
QSR footfall analytics gives operators the missing context: how many people entered, where they moved, how long they stayed, how full key areas became, and whether guest traffic converted into transactions. For multi-outlet teams, that creates a clearer foundation for staffing, layout, promotion review, service-area planning, and regional performance comparison.
xRetail Solutions brings this operating model together through xTrack for guest traffic measurement, Vortex Cloud for multi-outlet visibility, and xPilot 3 Pro for resilient outlet connectivity. For restaurant operators trying to make faster decisions with cleaner data, counting every guest is the first step toward running every outlet with more confidence.
FAQ
What is footfall analytics for restaurants?
Footfall analytics for restaurants measures guest traffic and movement inside an outlet. It can include footfall counting, people counting, occupancy monitoring, dwell time analytics, zone analysis, shopper journey patterns, and conversion from visits to transactions.
Why is POS data not enough for QSR operations?
POS data shows completed transactions, but it does not show how many guests entered, which service areas they used, how long they stayed, or whether traffic converted effectively into sales. Footfall analytics adds the missing pre-transaction context.
How can restaurant chains use footfall counting?
Restaurant chains can use footfall counting to compare guest traffic by outlet, daypart, campaign period, and location format. This supports staffing reviews, promotion analysis, conversion checks, and multi-outlet performance comparison.
What is the difference between footfall and occupancy?
Footfall measures entries over a period of time. Occupancy measures how many people are present in a defined area at a point in time. Both are useful, but they answer different operational questions.
How should operators validate people-counting data?
Operators should validate results against manual observation during peak periods, quieter periods, and difficult lighting conditions. Camera angle, lighting, occlusion, visitor definitions, and overlapping zones can affect measurement quality.
See how xRetail Solutions helps restaurant chains connect xTrack footfall analytics, Vortex Cloud visibility, and xPilot 3 Pro network resilience across every outlet. Contact xRetail for a store-operations assessment.
Frequently Asked Questions
What is footfall analytics for restaurants?
Footfall analytics for restaurants measures guest traffic and movement inside an outlet. It can include footfall counting, people counting, occupancy monitoring, dwell time analytics, zone analysis, shopper journey patterns, and conversion from visits to transactions.
Why is POS data not enough for QSR operations?
POS data shows completed transactions, but it does not show how many guests entered, which service areas they used, how long they stayed, or whether traffic converted effectively into sales. Footfall analytics adds the missing pre-transaction context.
How can restaurant chains use footfall counting?
Restaurant chains can use footfall counting to compare guest traffic by outlet, daypart, campaign period, and location format. This supports staffing reviews, promotion analysis, conversion checks, and multi-outlet performance comparison.
What is the difference between footfall and occupancy?
Footfall measures entries over a period of time. Occupancy measures how many people are present in a defined area at a point in time. Both are useful, but they answer different operational questions.
How should operators validate people-counting data?
Operators should validate results against manual observation during peak periods, quieter periods, and difficult lighting conditions. Camera angle, lighting, occlusion, visitor definitions, and overlapping zones can affect measurement quality.
Sources
- Singapore Department of Statistics: Monthly Retail Sales Index and Food & Beverage Services Index, June 2026
- Singapore Department of Statistics: Monthly Retail Sales Index and Food & Beverage Services Index, February 2026
- EnterpriseSG: Food Services
- EnterpriseSG: F&B Process Optimisation Programme
- EnterpriseSG and IMDA: Refreshed Food Services Industry Digital Plan
Related Articles
Continue exploring insights from xRetail Solutions
Seeing Beyond the Door: How Footfall Analytics Give APAC Retail Leaders Real-Time Store Intelligence
September 1, 2026
xRetail at IRSE 2026: Rethinking Retail with Indonesia’s Retail Leaders
August 27, 2026
One View of Every Store: How Unified Operations Dashboards Give APAC Retail Leaders Real-Time Control
August 27, 2026Ready to Transform Your Retail Operations?
Explore how xRetail Solutions connects shopper intelligence, resilient store networks, and unified operations visibility for modern retail teams.
Contact Our Team