
Retail Analytics Vietnam: Measuring Replenishment and Advice-Led Pet Store Visits
Vietnam pet retailers face a deceptively simple measurement question: was a store visit a quick replenishment trip, or did the shopper need time and staff guidance to make a considered choice? Retail analytics Vietnam teams use can help clarify the operating pattern, but only when every metric is defined carefully.
A customer picking up a familiar bag of pet food may move through the store quickly. Another may compare ingredients, nutrition, pack size, life stage or product suitability before asking a staff member for guidance. Both visits count as entries. They can create very different demands on merchandising, inventory and service capacity.
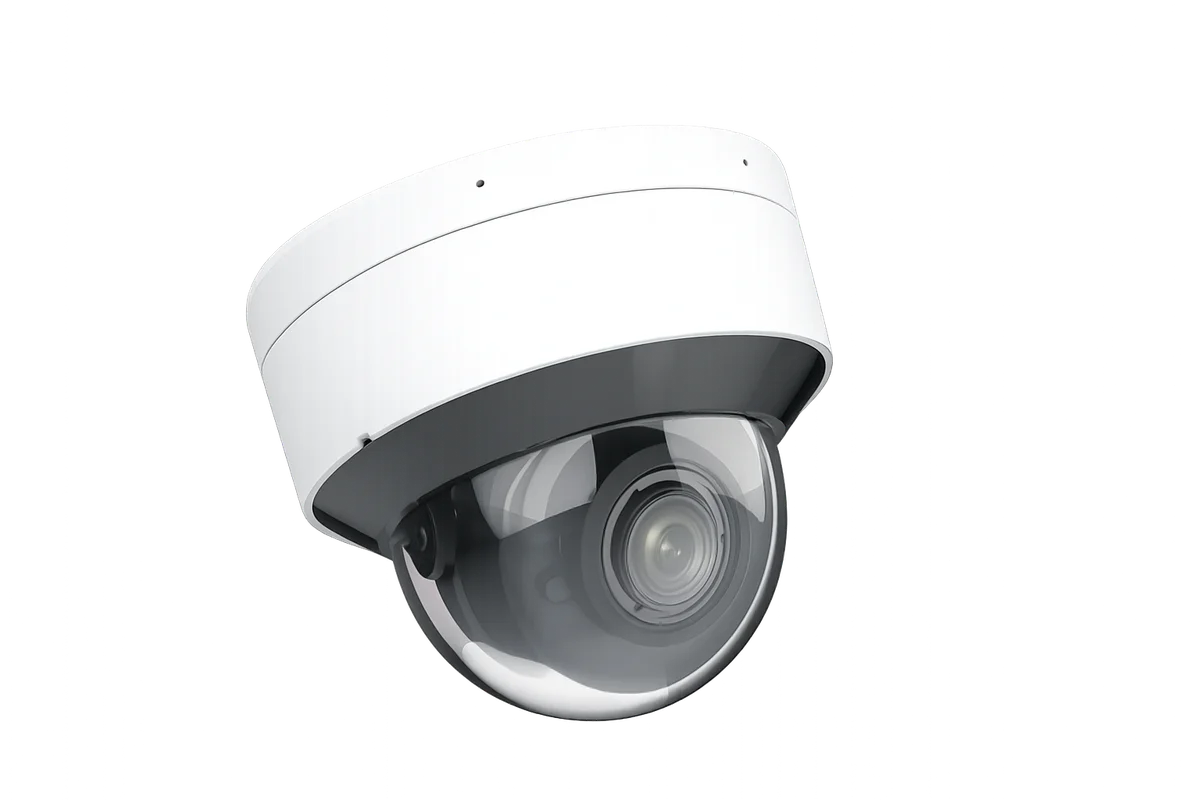
xTrack
xTrack helps retailers understand store traffic and conversion patterns.
Learn More →Traffic alone cannot identify either mission. It also cannot show that the same person returned. The useful approach is to combine eligible entries, transactions, observed service interactions, category movement, stock availability and promotion timing at an aggregate level. This produces operational evidence without turning counts into unsupported claims about customer identity.
Retail analytics Vietnam: define the units before comparing pet stores
The first step is not a dashboard. It is a measurement dictionary. Every participating outlet should use the same written definitions so that teams know exactly what each number represents.
Useful units include:
Eligible store entries: entry events included under a documented counting rule, with staff movements, known non-shopping access points and other exclusions handled consistently.
Transactions: completed POS transactions during the matched reporting period.
Baskets: the set of items recorded in a transaction. A basket is a purchase record, not a person.
Advice interactions: requests for product guidance recorded through a short manual observation method or another explicitly documented operational process.
Service duration: the elapsed time for an observed advice interaction, measured under a consistent start-and-end rule.
Category or SKU movement: units sold or inventory movement for the category being studied.
Promotion exposure window: the precise dates, trading hours, outlets, products and mechanics included in a promotion analysis.
Stock availability: whether the relevant products were available when traffic and transactions were measured.
These definitions matter because similar-looking figures may answer different questions. An entry counter records events under a rule. A POS system records purchases. A manual tally records observed requests for help. Inventory data records product movement. None of these measures should be treated as a proxy for customer identity.
Separate aggregate traffic from person-level tracking
Footfall analytics Vietnam retailers use should be described as the measurement of eligible visits or entries, not a count of unique people. A sequence of entry totals cannot establish that one shopper returned, even when timing or patterns appear similar.
Transactions also do not equal shoppers. One transaction may cover several visitors, while one visitor may complete more than one transaction. The same caution applies to baskets, category visits, service-area observations and dwell patterns. They describe activity at an aggregate level; they do not prove who performed it.
This distinction keeps store-performance reporting honest. It also improves decision quality. Instead of asking an unanswerable question such as “How many of today’s visitors came back?”, the team can ask questions that the available data can support:
When do eligible entries rise or fall?
When does traffic-to-transaction conversion change?
Which periods produce more observed requests for guidance?
Do promoted-category units change when traffic, price mechanics and stock availability are comparable?
Are staffing patterns aligned with periods of observed advice demand?
These are practical operating questions. They do not require a claim that aggregate store data identifies anyone.
Treat replenishment and advice-led visits as hypotheses
“Replenishment visit” and “advice-led visit” are useful working hypotheses, not classifications that traffic data can determine on its own.
To investigate a possible replenishment pattern, compare aggregate category or SKU sales cadence with inventory movement and eligible traffic. A recurring rise in units for a consumable category may help with demand planning, but it does not show that the same customers returned on a fixed schedule. Teams should also annotate promotions, stockouts, price changes and assortment changes that could explain the pattern.
To investigate advice demand, run a short, structured manual sample. Staff or observers can record a request when a shopper explicitly seeks product guidance, using the same definition across the sample. They can also record whether the request was served within the store’s chosen standard and, if useful, the broad category involved.
The method should remain simple enough to use consistently. Record only what the pilot needs. Do not infer an advice interaction from appearance, time spent near a shelf or movement through a service area. Those signals may help a team decide when to observe more closely, but they do not establish what a shopper needed.
Connect pet retail store traffic with POS at the same grain
Traffic and POS data become more useful when joined at the same outlet and time grain. If traffic is reported hourly, transactions should be aligned to the same outlet and hour. If the analysis uses full trading days, both datasets should follow the same opening hours and exclusion rules.
Traffic-to-transaction conversion can then be calculated as:
Transactions divided by eligible entries, multiplied by 100.
Illustrative example only: suppose one outlet records 500 eligible entries and 150 transactions during a matched period. The traffic-to-transaction conversion is 30 percent.
During the same illustrative period, suppose staff manually record 80 requests for product guidance and 60 are served within the store’s chosen service standard. Observed service coverage is 75 percent.
These figures are teaching arithmetic, not Vietnam benchmarks. They say nothing about unique shoppers or returning customers. They also should not be compared with another outlet until the team confirms that counting rules, trading hours, outlet format and observation methods are equivalent.
The calculation is most valuable as a prompt for investigation. If traffic rises while transactions remain stable, teams can review stock availability, promotion clarity, assortment, staffing and other operational context. If requests for guidance rise while observed service coverage falls, the store may need to test different service allocation during comparable periods. Neither result establishes the cause on its own.
Compare like with like
Reliable retail analytics depends on comparable windows. A weekday should not be casually compared with a weekend, and a normal trading period should not be treated as equivalent to a promotion or major calendar event.
Before interpreting a difference, match or annotate:
Weekdays and trading hours
Outlet format and selling area
Promotion mechanics and duration
Relevant assortment and stock availability
Major calendar and local trading effects
Sensor or POS outages
Counting-rule or store-layout changes
Manual observation coverage
For multi-outlet operators, this discipline matters more than ranking stores from highest to lowest. An outlet in a different location, format or operating context may have a structurally different traffic pattern. Store performance comparison should begin with comparable groups and transparent exclusions.
Measure promotions as a connected operating system
A promotion can affect several parts of the store journey, so the evaluation should use more than one metric. A practical promotion view can compare:
Eligible traffic
Transactions
Traffic-to-transaction conversion
Promoted-category units
Basket value
Manually observed advice interactions
Observed service coverage
Stock availability
Traffic lift is not automatically sales lift. It is also not evidence of more repeat customers. Promoted-category growth can be constrained by stock availability, while a complex offer may increase requests for guidance. A conversion change can reflect several factors, including visitor group size and the possibility that one visitor creates multiple transactions.
The right conclusion is often conditional. For example: during matched hours, the test period recorded higher eligible traffic and promoted-category units, while conversion was stable and stock remained available. That statement reports the observed pattern without inventing a cause or a customer identity story.
Use repeat-purchase windows for demand planning, not identity claims
Repeat-visit retail measurement requires special care. Aggregate POS can reveal intervals between category demand peaks, and inventory records can show how quickly particular products move. These patterns can inform replenishment planning, promotion timing and staffing discussions.
They cannot prove that the same shopper returned.
A retailer with a separate, lawful and disclosed customer-linked dataset may be able to answer person-level questions under its own governance and legal review. That is outside this aggregate framework. For most store-performance pilots, the cleaner approach is to discuss demand cycles, purchase intervals at category level and recurring traffic patterns without attaching them to individuals.
A practical pilot acceptance plan
A useful pilot should end with a decision, not simply a collection of charts. Before data collection begins, document the following:
1. Pet store analytics Vietnam: metric definitions
Write the eligibility rule for entries, the POS transaction definition, the manual advice-interaction rule, the service standard and the stock-availability measure. Name an owner for each source.
2. Baseline and test windows
Choose windows that reflect the retailer’s operating cycle. Match weekdays, trading hours, outlet format and promotion conditions where possible. There is no universal pilot duration.
3. Counter-validation
Perform sample manual counts against the entry measure and reconcile POS totals with the reporting extract. Record unexplained variance rather than smoothing it away.
4. Advice sampling
Specify who records requests, when sampling occurs, what qualifies as a request and how service coverage is calculated. Check that the method is applied consistently across periods.
5. Operational annotations
Maintain a simple log for stockouts, promotion changes, altered trading hours, unusual events, outages and counting-rule changes.
6. Pre-agreed thresholds
Set data-quality and operating thresholds from the retailer’s own baseline variance and commercial priorities. Do not adopt a generic industry threshold without evidence that it fits the stores being studied.
7. Named owners and decision rule
Assign owners for traffic, POS, inventory, observations and review. Agree in advance what evidence will lead the team to continue, revise or stop the pilot.
An example acceptance scorecard might ask whether entry counts pass the agreed sample check, POS periods reconcile, advice sampling reaches the planned coverage, stock and promotion annotations are complete, and matched comparisons can be reproduced. The values should come from the retailer’s baseline, not from an external benchmark.
From measurement to better store decisions
The value of retail analytics Vietnam operators can use is not a claim to know every shopper. It is a clearer connection between store activity and operating decisions.
For pet retailers, that means distinguishing what is directly measured from what remains a hypothesis. Eligible entries describe traffic. POS describes transactions and baskets. Inventory shows product movement. Manual observation can document advice demand. Context explains whether periods are genuinely comparable.
Used together, these measures can help teams plan service coverage, investigate conversion changes, compare promotions and understand category demand. Used carelessly, the same numbers can produce false stories about visit purpose or returning customers. The strongest measurement plan is the one that states its limits as clearly as its findings.
The pet-food studies are not Vietnam-specific. They support the general proposition that pet-food decisions can involve multiple product and health considerations, not any numerical claim about shoppers in Vietnam.
Build a clearer view of pet-store performance. Discuss an aggregate measurement plan that connects eligible traffic, transactions and operating context across your Vietnam stores.
xTrack helps retailers understand store traffic and conversion patterns. Learn more at /products/xtrack-dome.
Frequently Asked Questions
What does footfall measure in a pet store?
Footfall measures eligible entry events under a documented counting rule. It does not inherently measure unique people, customer identity or returning customers.
Can traffic and POS data identify replenishment visits?
Not on their own. Aggregate category cadence, SKU movement and stock context can support a replenishment hypothesis, but they cannot prove an individual shopper’s purpose or identity.
How should a store measure demand for product advice?
Use a short, documented manual sample or another explicit operational measure. Define what qualifies as a request, when observations occur and how service coverage is calculated. Do not infer a request from appearance or movement alone.
What is traffic-to-transaction conversion?
It is transactions divided by eligible entries for the same store and matched period. Interpret it carefully because a transaction is not a person: several visitors may share one transaction, and one visitor may make more than one.
Can aggregate sales data show repeat customers?
No. Aggregate POS can show recurring demand patterns or intervals between category peaks, but it cannot establish that the same customer returned.
How should Vietnam pet retailers set pilot targets?
Targets should be derived from each retailer’s baseline variance, operating cycle, promotion calendar and data quality. There is no universal duration or success threshold.
Sources
- National Statistics Office of Vietnam, “Report socio-economic performance in July and 7 months of 2026,” issued 3 August 2026
- National Statistics Office of Vietnam, “Socio-economic situation in the fourth quarter and 2025,” issued January 2026
- Schleicher, Cash and Freeman, “Determinants of pet food purchasing decisions,” Canadian Veterinary Journal, June 2019
- Ai et al., “What Drives Pet Food Choices? A Systematic Literature Review,” Animals, published 7 November 2025
Related Articles
Continue exploring insights from xRetail Solutions

Retail analytics Indonesia: Reading Footwear Store Visits Beyond the Fitting Bench
October 29, 2026
Retail Analytics Philippines: Staffing Toy Stores for Family Visits
October 27, 2026
Retail Analytics Thailand: From Optical Trade Events to Store-Level Decisions
October 23, 2026Ready to Transform Your Retail Operations?
Explore how xRetail Solutions connects shopper intelligence, resilient store networks, and unified operations visibility for modern retail teams.
Contact Our Team